Monitoring your Homelab k3s

Flashback
The k3s homelab is ready, clean and fully functional.
If you landed on this article without any context, I’d suggest checking out the previous one first: Building your homelab with RPis

If you’re reading this line, I think you’re all set to keep going! Let’s go.
Why, how, where?
Right now, we have zero visibility into the homelab, unless we connect to it via k9s, or worse, SSH into each node manually to check on hardware health.
Obviously, that’s not gonna fly. We need to set up a few nice things to make our lives easier.
Let’s start by laying out what we want:
- Visibility on the hardware side (CPU, memory, disk, and network usage) -> hardware observability.
- The ability to access it from outside our local network, while keeping a reasonable level of security.
Let’s dig into each of these.
Observability
No need to reinvent the wheel here. I already know what I want, given how many times I’ve set this up on client engagements. The prometheus - grafana stack. A timeless classic, it just works.

To put it simply: it’s a classic stack that lets you:
- collect metrics (whatever they are) -> Prometheus
- have a clean and efficient UI to do whatever you want with them (dashboards, aggregations, etc) -> Grafana.
Once again, no reinventing the wheel here — we’ll use kube-prometheus-stack to deploy the whole thing.
Pretty straightforward, we’ll use the Helm package manager, which lets you install multiple services in one shot.
Here’s a quick screenshot of the interface, with a pre-built dashboard for hardware metrics:
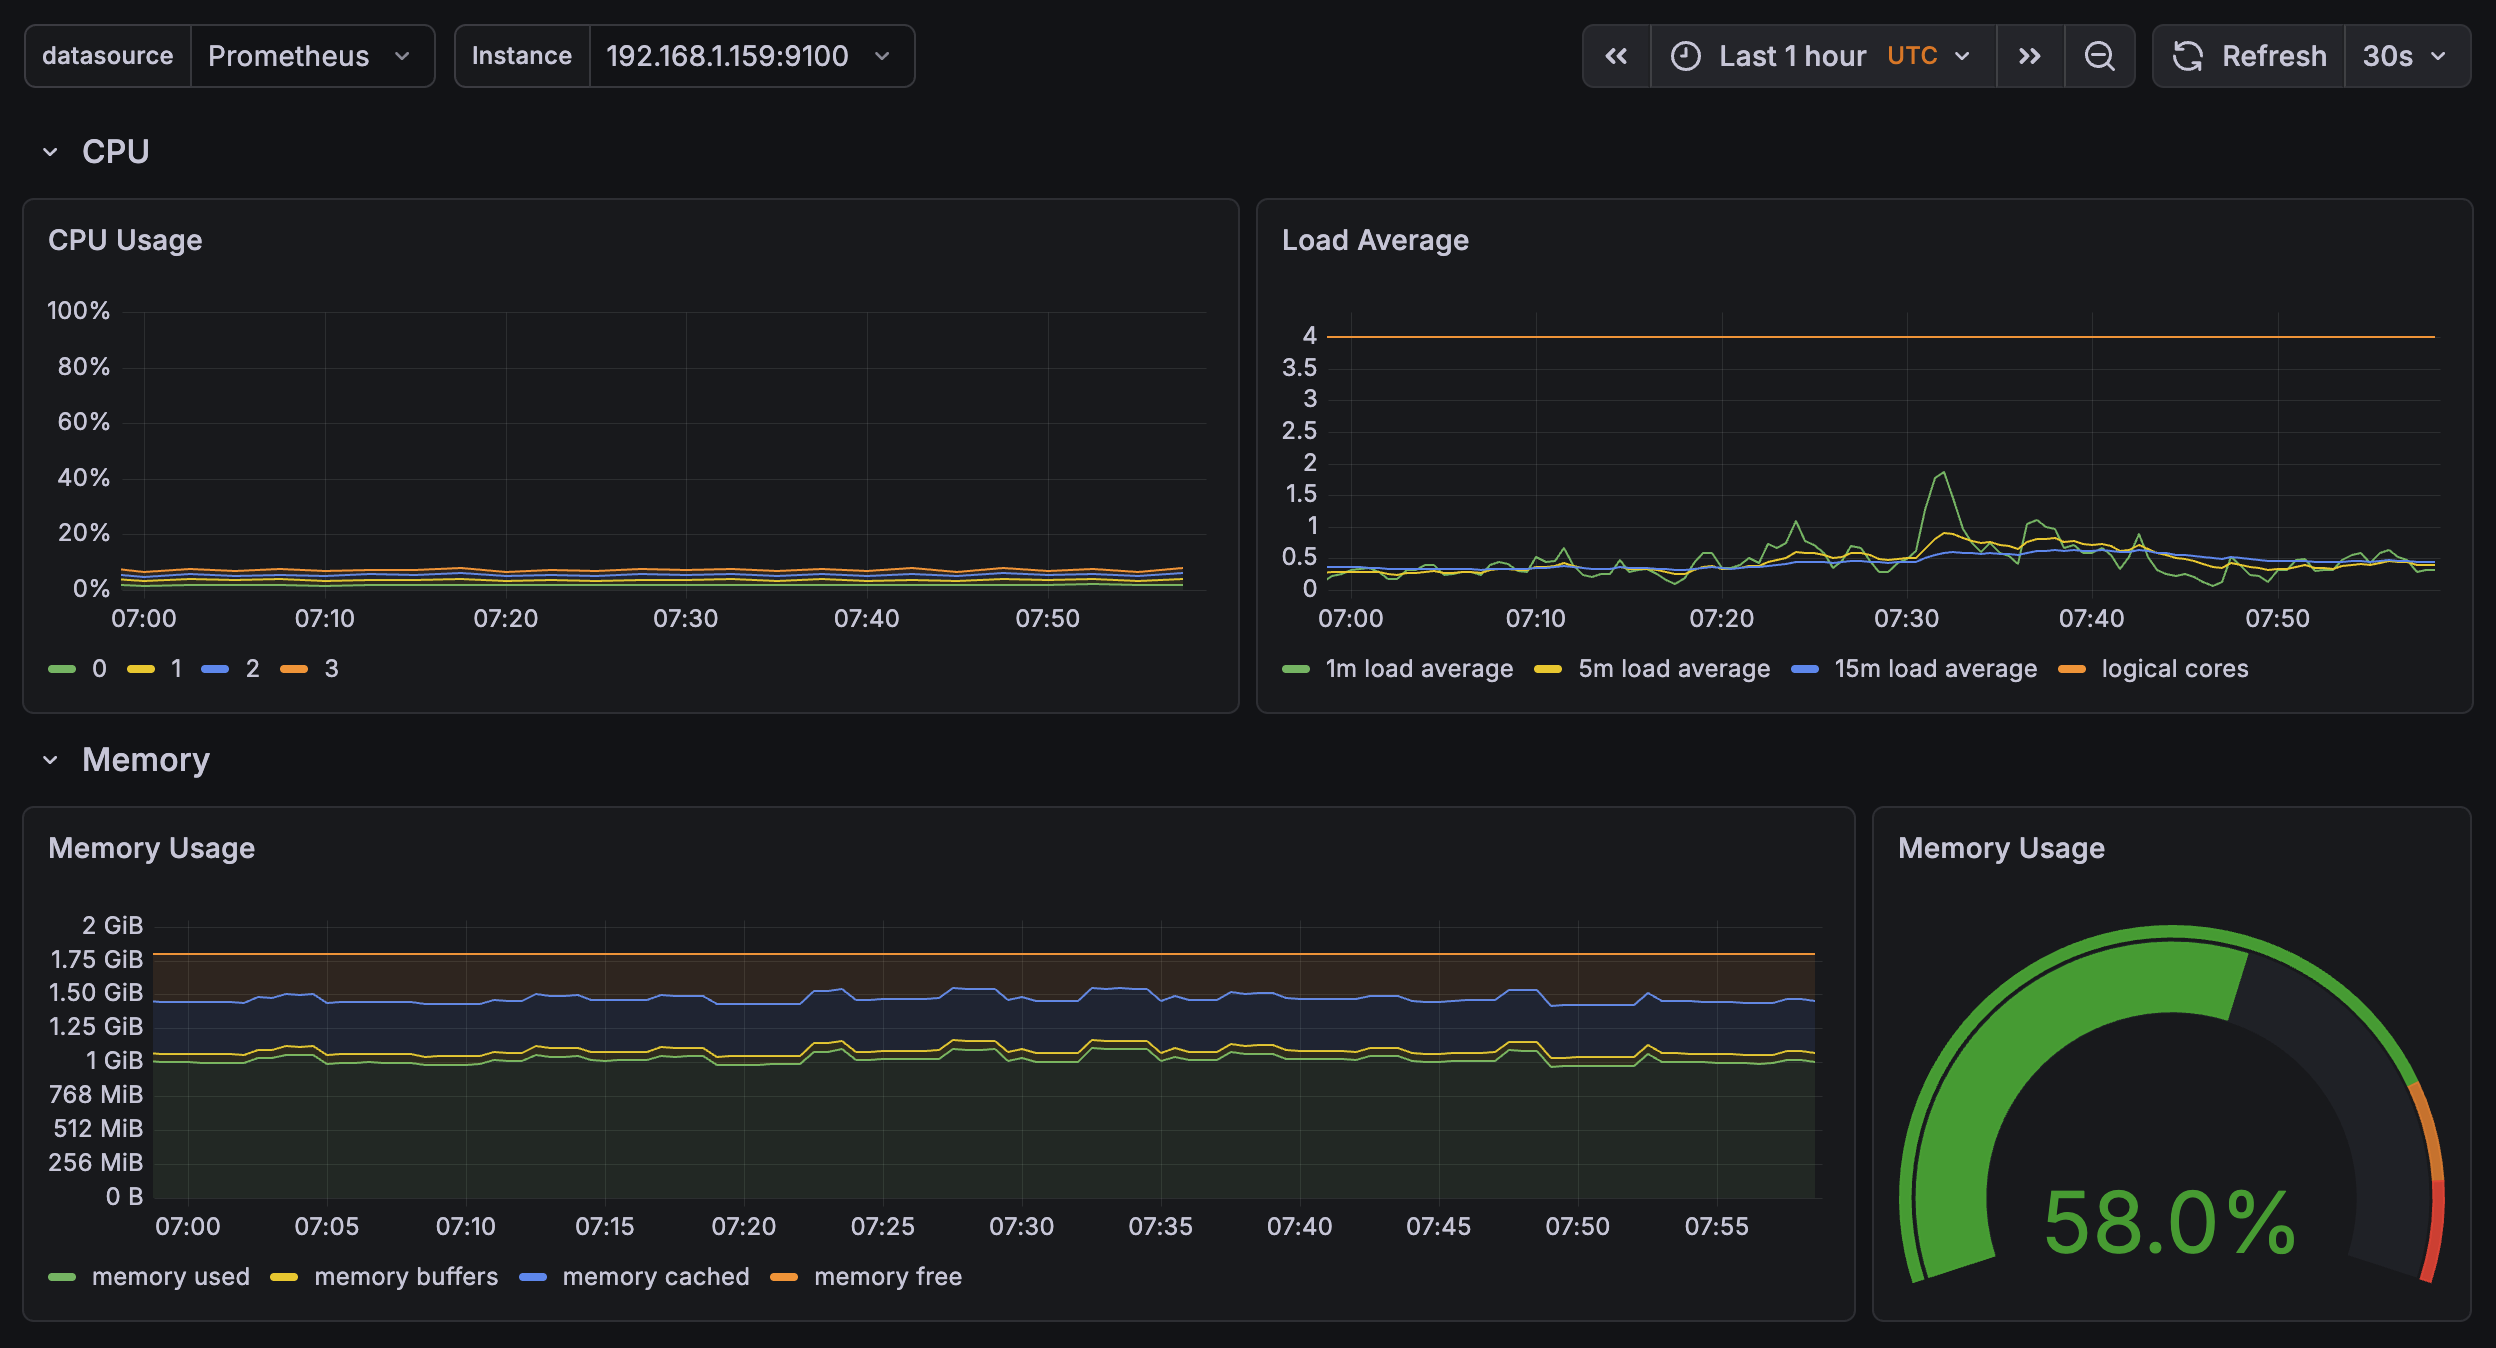
Here we can see an overview of what’s happening on the cluster, specifically on one rpi (the control plane here).
Not much going on… for now (which is totally normal, relax).
Nothing too crazy, and we already have direct access to hardware data.
Note: this stack isn’t just for pulling hardware metrics. You can plug in other data sources:
- Loki -> to ship container logs into Grafana
- Custom metrics -> you can define metrics directly in your code (meaning in your apps) and visualize them in Grafana.
You can also push Grafana further: if you want to get alerted on anomalies, you can hook it up to external services (Slack, Discord, you name it).
This opens up a lot of room for improvement and makes maintenance way easier.
Like I said in the previous article: we don’t do things halfway.
Accessibility
Alright, this is all great, but if I’m not home, I have zero visibility and can’t access anything.
A real shut-in of a project.

To solve this, we need to properly frame the problem before we start breaking things.
We want two distinct things:
- access from outside to tools / apps, but only us (private network basically)
- access to apps from the internet, fully public (no network-level restrictions)
For the first one, I’ll use a tool I discovered at Boxy (RIP…) -> Tailscale.
Tailscale, what is that now?

Simply put, it’s a SaaS that lets you create a virtual private network between machines that aren’t physically in the same place, on the same network. It’s built on Wireguard, among other things (you know, the thing powering that VPN you bought to… watch anime on Netflix Japan).
Basically, Tailscale lets you connect your machines together, and define within your private network who has access to what. Which is exactly what we want!
You create your Tailscale account (free), register your devices (iPhone, NAS, personal Mac, etc) and you can access exposed services between each machine. Nice.
And how does it work in your homelab?
Pretty simple. We’ll set up the homelab at a few levels.
First, we want to be able to access our cluster via kubectl (k9s TUI for us).
Simple solution -> install tailscale on the control plane, it joins our VPN and is therefore reachable from my Mac, for example. Side note: you just need to update the IP in your kubeconfig to point to the control plane’s IP in the VPN for it to work.
For k9s, done.
For our services, we’ll take a different approach.
Take the Grafana dashboard as an example. It’s reachable via a cluster IP, so you just need to be on the local network to access it.
To access it through the Tailscale VPN, we need to:
- create a Tailscale OAuth client
- install the tailscale-operator with the right OAuth credentials
- define a Tailscale ingress to serve our app inside the Tailscale VPN
Quick example for reference:
Our sample application:
apiVersion: v1
kind: Namespace
metadata:
  name: my-app
---
apiVersion: apps/v1
kind: Deployment
metadata:
  name: my-app
  namespace: my-app
spec:
  replicas: 1
  selector:
    matchLabels:
      app: my-app
  template:
    metadata:
      labels:
        app: my-app
    spec:
      containers:
        - name: my-app
          image: tiangolo/uvicorn-gunicorn-fastapi:python3.11-slim
          ports:
            - containerPort: 80
---
apiVersion: v1
kind: Service
metadata:
  name: my-app
  namespace: my-app
spec:
  selector:
    app: my-app
  ports:
    - port: 80
      targetPort: 80
And the Tailscale ingress:
apiVersion: networking.k8s.io/v1
kind: Ingress
metadata:
  name: my-app
  namespace: my-app
spec:
  ingressClassName: tailscale
  rules:
    - http:
        paths:
          - path: /
            pathType: Prefix
            backend:
              service:
                name: my-app
                port:
                  number: 80
  tls:
    - hosts:
        - my-app
And just like that, our app is accessible at https://my-app.your-tailscale.ts.net
Clean, functional, and secured.
Note 1: Tailscale is still a SaaS, so it’s a trusted third party by definition for the service it provides.
Tailscale uses some pretty smart tech, like NAT traversal to establish direct connections. In that case, nothing goes through their servers.
But, if you ever feel like self-hosting your own Tailscale, you can run Headscale and rest easy. It’s basically an open source, self-hostable version.
Note 2: With Tailscale, you can now create Funnels to expose apps to the entire internet. But it’s still in beta, the bandwidth is limited and not really documented (at least I couldn’t find it). So it technically covers the second use case, but it’s not reliable enough yet.
That’s why we went with a more robust solution for public internet access: Cloudflare Tunnel.
Cloudflare, yet another cloud thing?
Well yes, another cloud thing… but for a good reason!
Say I need an app that should be accessible from the internet (let’s say, the analytics for this blog :)).
With Tailscale we’re limited, we need a stable solution. One option is to open ports on our router and allow inbound traffic from the outside. That works, but we’re not doing that here.
The other option is to create a tunnel between our homelab and the outside world. That’s exactly what we’ll do here, using Cloudflare Edge.
The setup
The simplest approach is to have a domain name on Cloudflare. Otherwise it gets annoying. Let’s stick with that.
The traffic flow looks like this:
Internet -> Cloudflare Edge -> [encrypted tunnel] -> cloudflared pod -> your service
I won’t go into the full setup details, Claude is your friend :)
It’s free, solid, and stays secure.
Conclusion
A slightly more technical article (but not too bad, don’t worry), that sets us up for what’s next: deploying real apps on the cluster, accessible both privately and publicly.
But that, I’ll cover in the next articles.
Spoiler: AI agents, LLMs, GPUs, and many other things.
Until then, take care.
Adem.